Since the last issue of Polars in Aggregate, we had four Python releases (0.20.3 to 0.20.6) and a two Rust releases (0.36.2 and 0.37.0). These releases contained many performance improvements, bug fixes, breaking changes and new features. In this issue of Polars in Aggregate we provide an overview of the highlights.
Note: All benchmarks in this edition were executed on an m6i.4xlarge (vCPU 16, RAM 64GB) instance type on AWS. The
scripts are available as GitHub Gists. You can find the links to the Gists at the
end of this blog post, so that you can run the benchmarks yourself as well.
1. New String type #13748
One of the biggest changes in the last few weeks has been the complete rewrite of the string/binary type. This change was imminent and patches some pathological performance cases. One of them shown below in the filter operation.
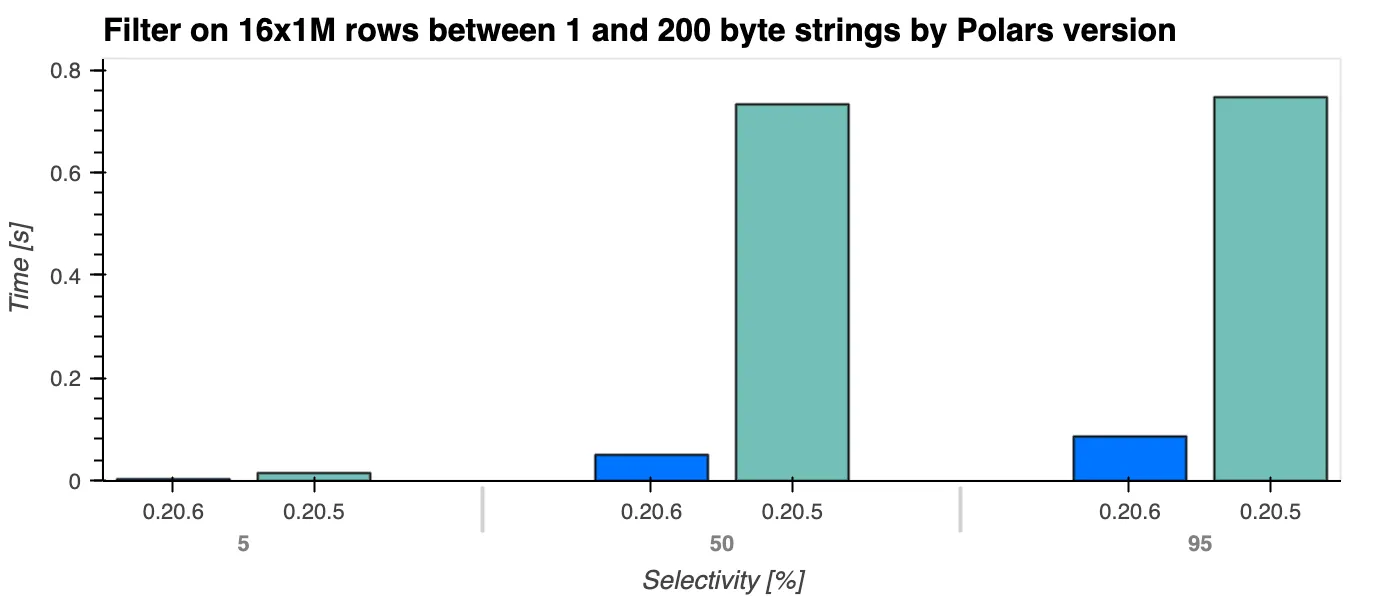
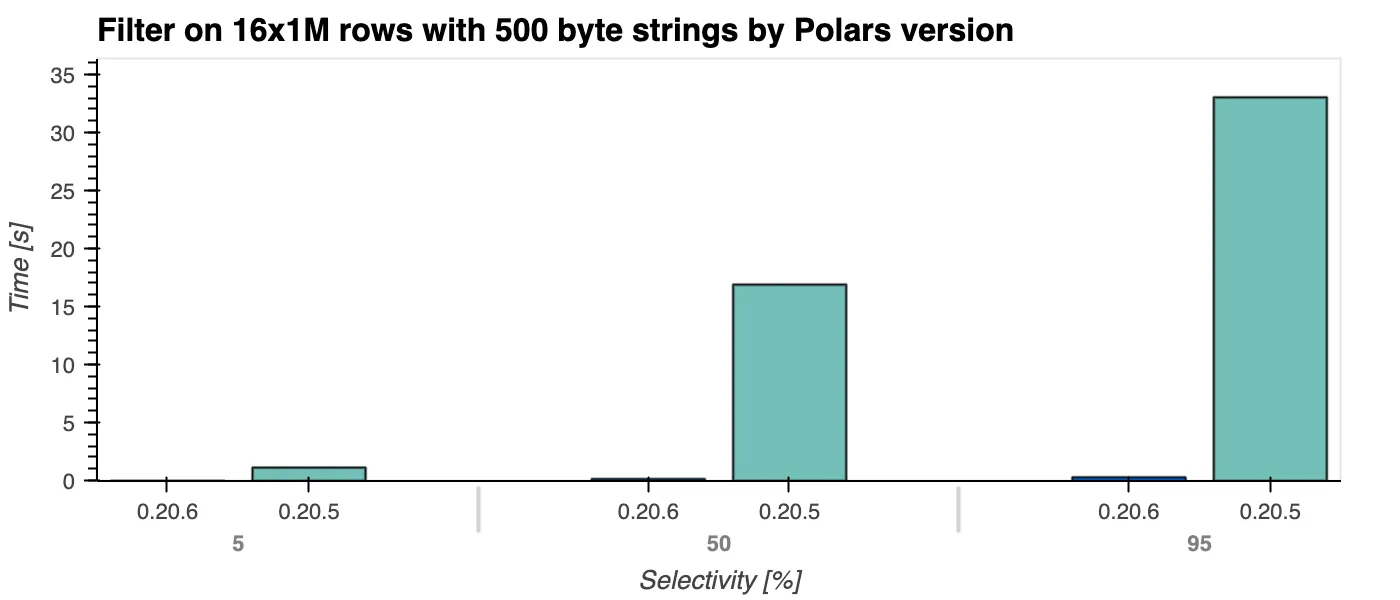
Here we see that filtering time complexity has gone from $O(n \cdot k)$ to $O(n)$, the filter performance is completely independent from the string length k. Not only the filter operation was improved, but we expect many operations to have better performance.
You can read more about the details in our blog post.
2. Plotting in Polars with hvPlot #13238
We believe that with a strong focus you achieve more. That it is why we have refrained from implementing plotting functionality even though it has been requested several times. Plotting isn’t a core task, and we want to leave the plotting niche to the experts. However, we know how useful it is to get some insight into your data when you are doing interactive data exploration.
For this reason, we looked for a way to provide this utility without having any of the plotting logic in Polars, but rather sending it to a library that can work with Polars and support different plotting backends. We found this in hvPlot. hvPlot can output plots in a variety of formats. You can choose to generate an interactive Bokeh or Plotly plot or a static Matplotlib plot.
The feature is installable with a feature flag.
pip install "polars[plot]"Visit the GitHub gist for the DataFrame generation
df = pl.DataFrame({
    "StockPrice": prices,
    "Dates": dates
})

df.plot.line(x="Dates", y="StockPrice")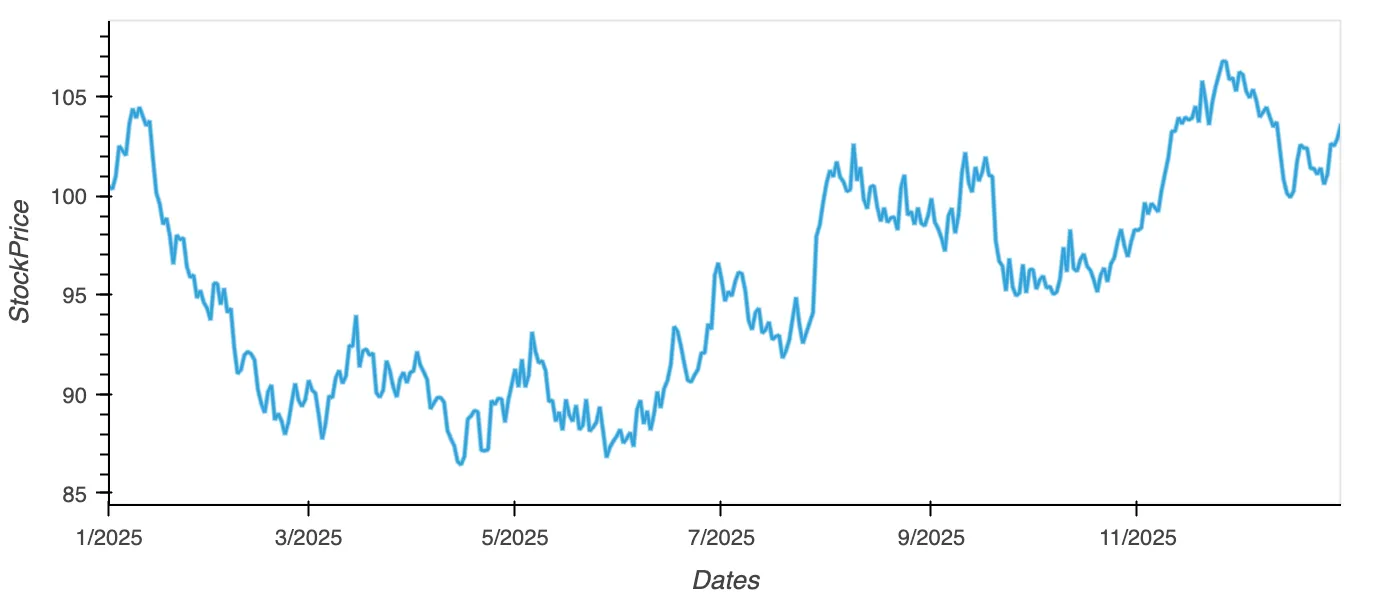
Below is an example of a scatterplot with a legend and a hue based on species. It shows the ease of which plots can be created to get an insight in what is going on in your data.
scatter_df = pl.read_csv("https://raw.githubusercontent.com/pola-rs/polars/main/docs/data/iris.csv")

scatter_df.plot.scatter(x='sepal_length', y='sepal_width', by='species', legend='right')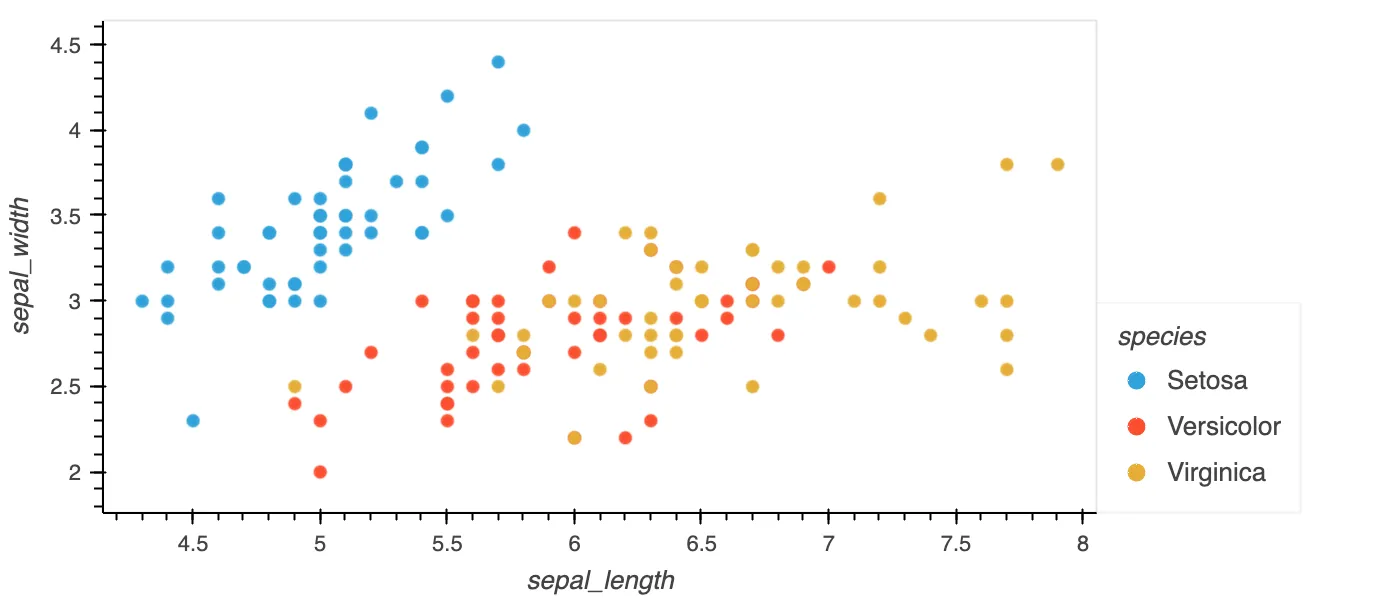
3. Enhancing the SQL front-end with new features
Polars, mainly focuses on DataFrame front-ends, but it also has a SQL front-end. It allows users to write SQL queries that are translated directly into Polars LazyFrames. This means that you can even mix the Polars API with a SQL query and have both translated to Polars’ fast physical engines. This can be particularly useful for teams that already have an existing SQL code base, or those using both SQL and DataFrames. Although we strongly encourage you to explore the more expressive syntax of expressions, as this is also more feature complete and allows more meta-programming, a significant number of new SQL statements have recently become available.
A small selection of recently supported features:
EXTRACTandDATE_PART- #13603REGEXPandRLIKEpattern matching - #13359LIKEandILIKE- #13522IF- #13491- Subqueries for
JOINandFROM- #12819 POSITIONandSTRPOS- #13585REPLACE- #13431IFNULL- #13432
Read more about out the SQL interface in the user guide
4. Native implementation of Python DataFrame interchange protocol #10701
The DataFrame interchange protocol is a “protocol for zero-copy data interchange between Python DataFrame libraries”.
Essentially, this means that DataFrame libraries that implement this protocol can easily convert data to and from other DataFrame libraries that also implement it. Another benefit is that you can write code that is agnostic to the actual DataFrame implementation. Code written in the DataFrame interchange protocol will generalise to all libraries that implement that protocol.
This is particularly useful for third-party libraries that operate on DataFrames, such as plotting libraries or specialised computation libraries like scikit-learn. Instead of having to explicitly support every DataFrame library out there, they can simply use the protocol to convert incoming DataFrames to the format of their choice, or even better, express their logic in the protocol.
Polars had an early implementation that relied on PyArrow’s implementation of the protocol and the fact that Polars can convert to and from PyArrow without copying data. This was a good start, but had an important drawback in that it required Pyarrow as a dependency.
With the landing of (#10267) we ship a native implementation of converting Polars DataFrames to the protocol representation. The main hurdle was to expose the underlying buffers of the Polars series to the Python API, as these were previously only directly accessible in Rust.
The transition from the DataFrame protocol to Polars hadn’t been implemented yet. This implementation landed in Polars 0.20.4, with (#10701).
Polars now natively supports the interchange protocol, which should make it easier for third-party libraries to support Polars DataFrames without additional work. We also hope that this will encourage more authors of third-party libraries to write their core logic in Polars.
5. Introducing new Array expressions
Arrays are ideal for users working with matrices and vectors in machine learning or scientific contexts. The memory layout of Array can fit tensors and matrices in libraries such as numpy and pytorch. Other use cases for Arrays are when your data has a fixed size, like images.
Recent contributions are: join, count_matches, explode and contains. Adding to a growing list of expressions to
interact with Arrays.
5.1 An example
df = pl.DataFrame(
    {"a": [[1, 2], [1, 1], [2, 2]]},
    schema={"a": pl.Array(pl.Int64, 2)}
)

df.with_columns(number_of_twos=pl.col("a").arr.count_matches(2))
shape: (3, 2)
┌───────────────┬────────────────┐
│ a ┆ number_of_twos │
│ --- ┆ --- │
│ array[i64, 2] ┆ u32 │
╞═══════════════╪════════════════╡
│ [1, 2] ┆ 1 │
│ [1, 1] ┆ 0 │
│ [2, 2] ┆ 2 │
└───────────────┴────────────────┘Read more about the difference between Array and List in the user guide.
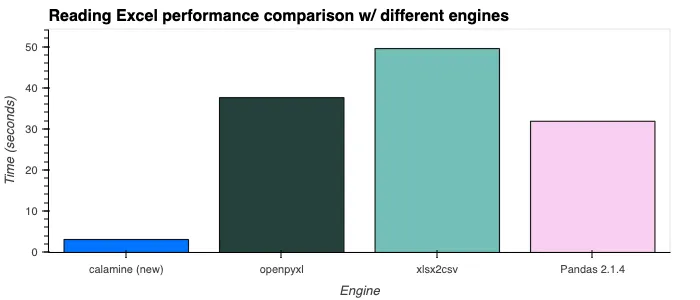
6. Improved Excel Reader #14000
We are also experimenting with the calamine engine as an Excel reading backend. We are aware that Excel is a widely used format and we hope to give it the attention it deserves in terms of reading performance.
The calamine engine is a very fast engine for the Excel format. Currently we expose the calamine engine with fastexcel, which exposes Arrow memory directly, meaning we don’t pay any serialisation costs. We are also thinking about extending the plugin system for readers. This means that both Rust and Python users would benefit from our implementations, and new readers could be exposed as lazy scan_* methods.
Below is a benchmark of results against (the) other engines.
7. Closing remarks
End of January we sent out our first newsletter. It is the ideal format if you to be kept up-to-date with all things Polars, including our releases and blog posts, delivered straight to your inbox. Subscribe using the form below.