Polars Cloud 0.9.0 is out.
The headline of this release is expression lowering: expressions inside select, with_columns, and filter now execute with distributed algorithms instead of collapsing to a single worker.
What’s new in this release:
- Expressions run distributed in
select,with_columns, andfilter. - A large cloud I/O performance improvement.
- A reworked
ClusterContextAPI. - Distributed unions of Python scans.
- A distributed Iceberg sink.
- Manual scaling for on-premise clusters.
- New disk I/O metrics.
Expressions Now Run Distributed
Operations on LazyFrames such as join, group_by, and select already had distributed implementations.
Expressions did not: whenever an expression needed to see an entire column, for example an aggregation like mean, all partitions were shuffled into a single stage and one worker did the work.
Take a query that keeps only the rows where calories equals the column maximum:
(
    pl.scan_csv("foods*.csv")
    .filter(pl.col.calories == pl.col.calories.max())
    .remote()
    .execute()
)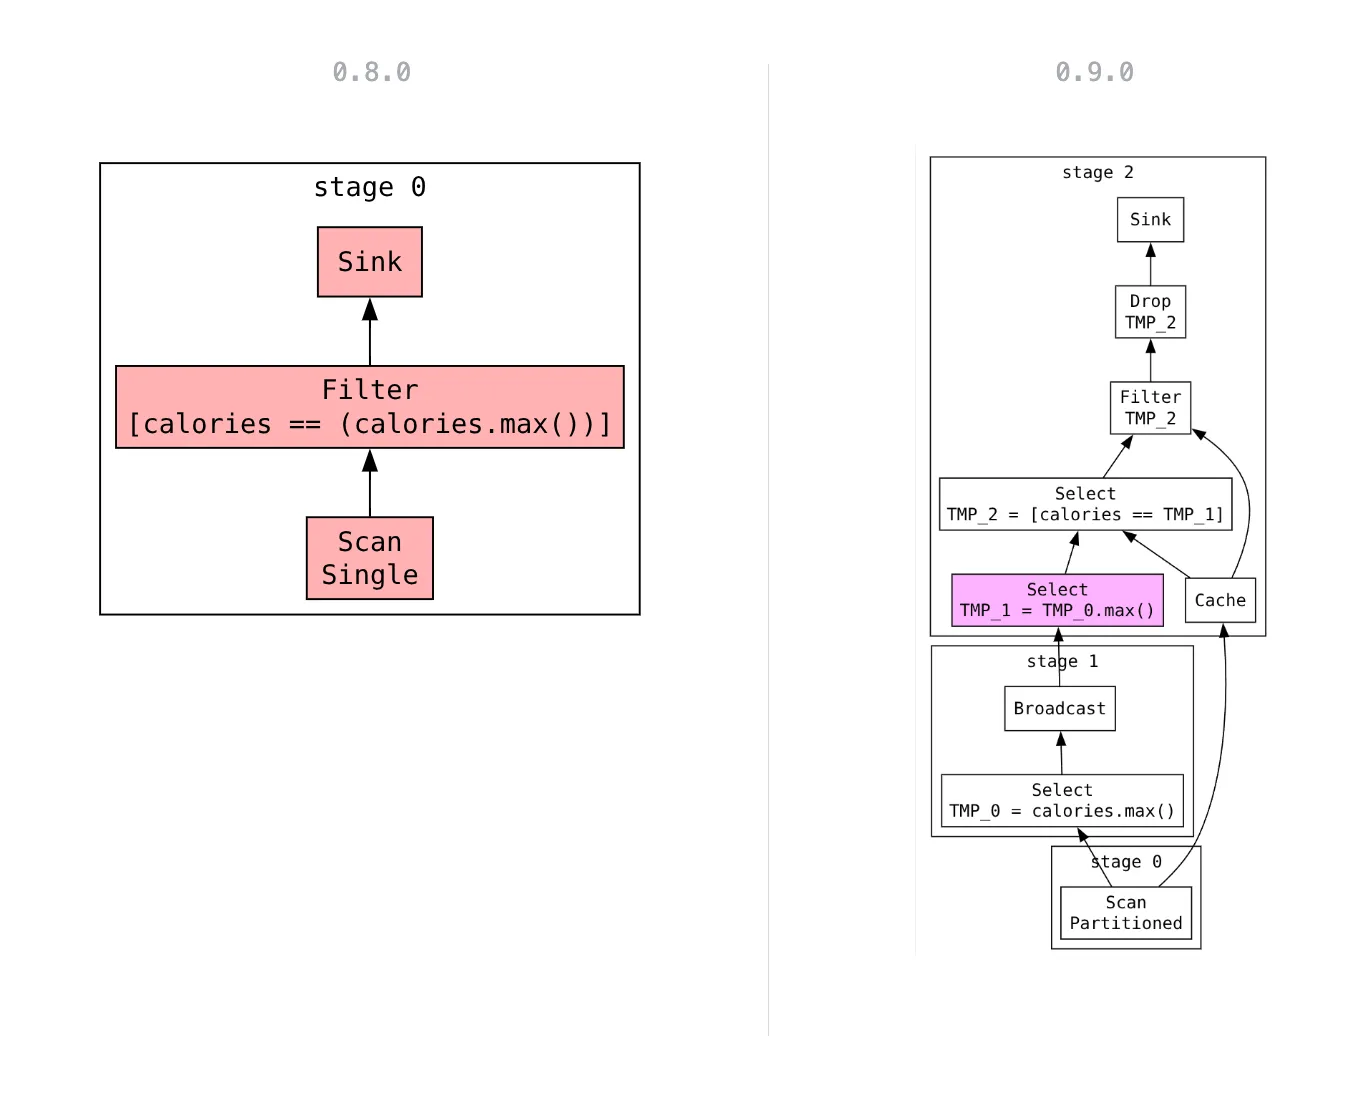
Legend: red nodes run single node, white are partitioned, pink are broadcast (same operation with the same data in every partition)
In this release, expression lowering is enabled for select, with_columns, and filter.
You’ll notice the biggest improvements when combining aggregating expressions such as first, max, mean, sum, var, std, or unique with other expressions.
Expressions without a distributed implementation yet fall back to the previous single-stage behavior, so every query keeps working.
We’re continuing to add distributed implementations for more expressions, and we welcome feedback on how this performs on your workloads.
Faster Cloud I/O
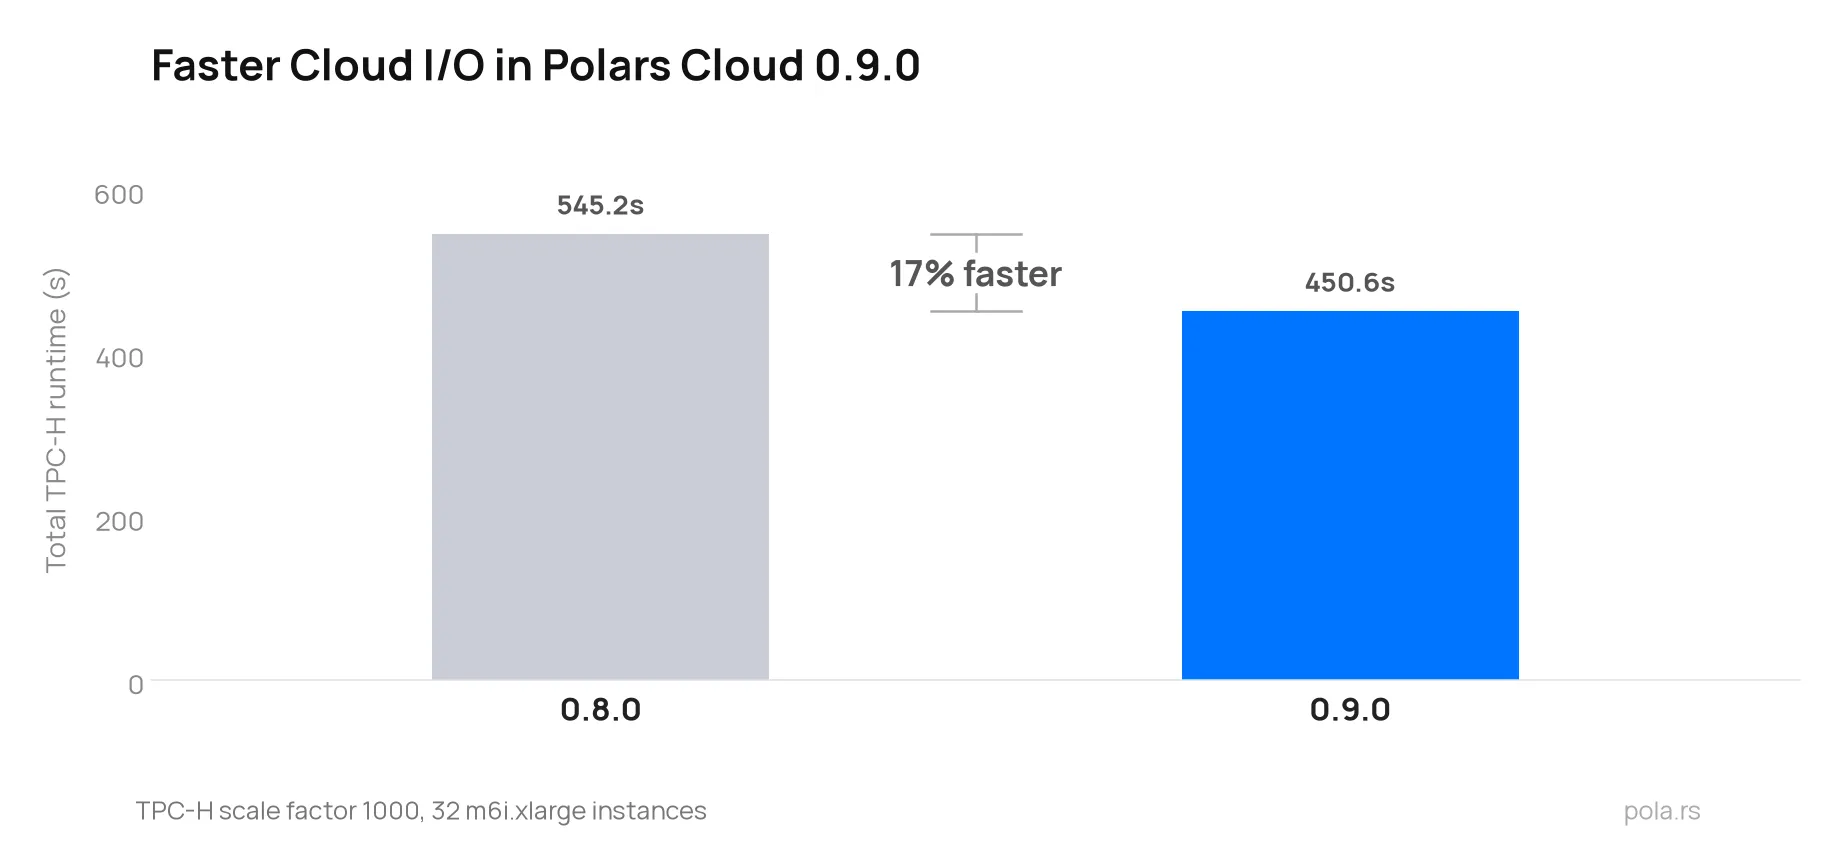
Polars 1.42 introduced an adaptive concurrency controller for reading from cloud object stores (#27924). It dynamically tunes the number of in-flight requests to the observed bandwidth and latency of the connection. Polars Cloud 0.9.0 ships this improvement on the cluster side.
The effect on distributed workloads is significant. On TPC-H scale factor 1000, running on 32 m6i.xlarge instances, total benchmark runtime dropped by 17%. The benchmark is I/O bound at this cluster configuration, and some individual queries were cut in half.
There is no API change. Existing queries benefit automatically after upgrading the cluster.
We’re preparing a blog post with a detailed breakdown of these benchmark results, coming out soon. Follow us on the channels below to catch it when it lands.
A Reworked ClusterContext API
ClusterContext connects the client directly to the scheduler of a self-hosted cluster, bypassing the Polars Cloud control plane.
In 0.9.0 its API is reworked to be more flexible and easier to configure.
This includes a breaking change: the keyword compute_address="..." is superseded by uri="...".
The old keywords are removed rather than deprecated, so code that still passes compute_address or scheduler_port raises a TypeError on upgrade. Update those call sites to uri="..." before upgrading the client.
import polars_cloud as pc

# Before 0.9.0
ctx = pc.ClusterContext(compute_address="10.0.0.5", scheduler_port=5051)

# 0.9.0
ctx = pc.ClusterContext(uri="https://10.0.0.5:5051")
The new parameter takes a complete URI instead of only a hostname or IP address.
If no port is given, it defaults to the scheduler port 5051.
Beyond the rename, connection configuration became more capable:
- SSL connections now use the system’s trusted Certificate Authorities by default.
- TLS behavior is configured through
tls_options. Theinsecureflag now only affects certificate validation instead of changing the protocol, so you can use HTTPS while optionally ignoring certificate errors. - Custom HTTP headers can be attached to every request using
extra_headers, for example anAuthorizationheader for a proxy in front of the cluster. - The Observatory connection can be configured independently from the scheduler. If you don’t, it is derived automatically from
urion the default port3001.
import polars_cloud as pc
from polars_cloud import ClientOptions, TLSOptions

with open("corp-ca.pem", "rb") as f:
    custom_ca = f.read()

ctx = pc.ClusterContext(
    uri="https://scheduler.internal:5051",
    tls_options=TLSOptions(ca_cert=custom_ca),
    extra_headers={"authorization": "Bearer <token>"},
    observatory=ClientOptions(uri="https://observatory.internal:3001"),
)
Distributed Unions of Python Scans
Polars supports custom data sources through IO plugins. Until now, a union of such scans could not be spread across the cluster, since the engine cannot partition an opaque Python source by itself.
0.9.0 recognizes a union of Python scans as a single multi-scan source. This means you can partition a custom source manually and let the scheduler distribute the branches across workers:
lf = pl.union([custom_scan(partition) for partition in partitions])

lf.remote(ctx).distributed().execute()
Distributed Iceberg Sink
You can now write Iceberg tables directly from distributed queries with sink_iceberg:
lf.remote(ctx).sink_iceberg(
    "sales.transactions",
    mode="append",
    catalog=catalog,
)
Workers write the Parquet data files in parallel, after which the table transaction is committed in a single step.
The mode parameter accepts "append" or "overwrite", and target can be a pyiceberg table object or a catalog identifier.
This feature is available when pyiceberg is installed on the cluster, and is currently marked unstable.
Manual Scaling for On-Premise Clusters
On-premise clusters can now be scaled manually by adding or removing worker nodes, provided the cluster is not configured with a fixed number of workers.
New workers register with the scheduler and become available for queries, and the planner adapts partition counts to the workers it finds.
Use the min_workers and max_workers parameters on distributed() to control how many workers a query waits for and uses.
New Disk I/O Metrics
The Observatory gives insight into your cluster while queries run. This release adds storage metrics next to the existing CPU, memory, and network charts:
- Disk utilization, for clusters with cgroup I/O accounting enabled.
- Disk read and write throughput, when disk I/O metrics are enabled on the cluster.
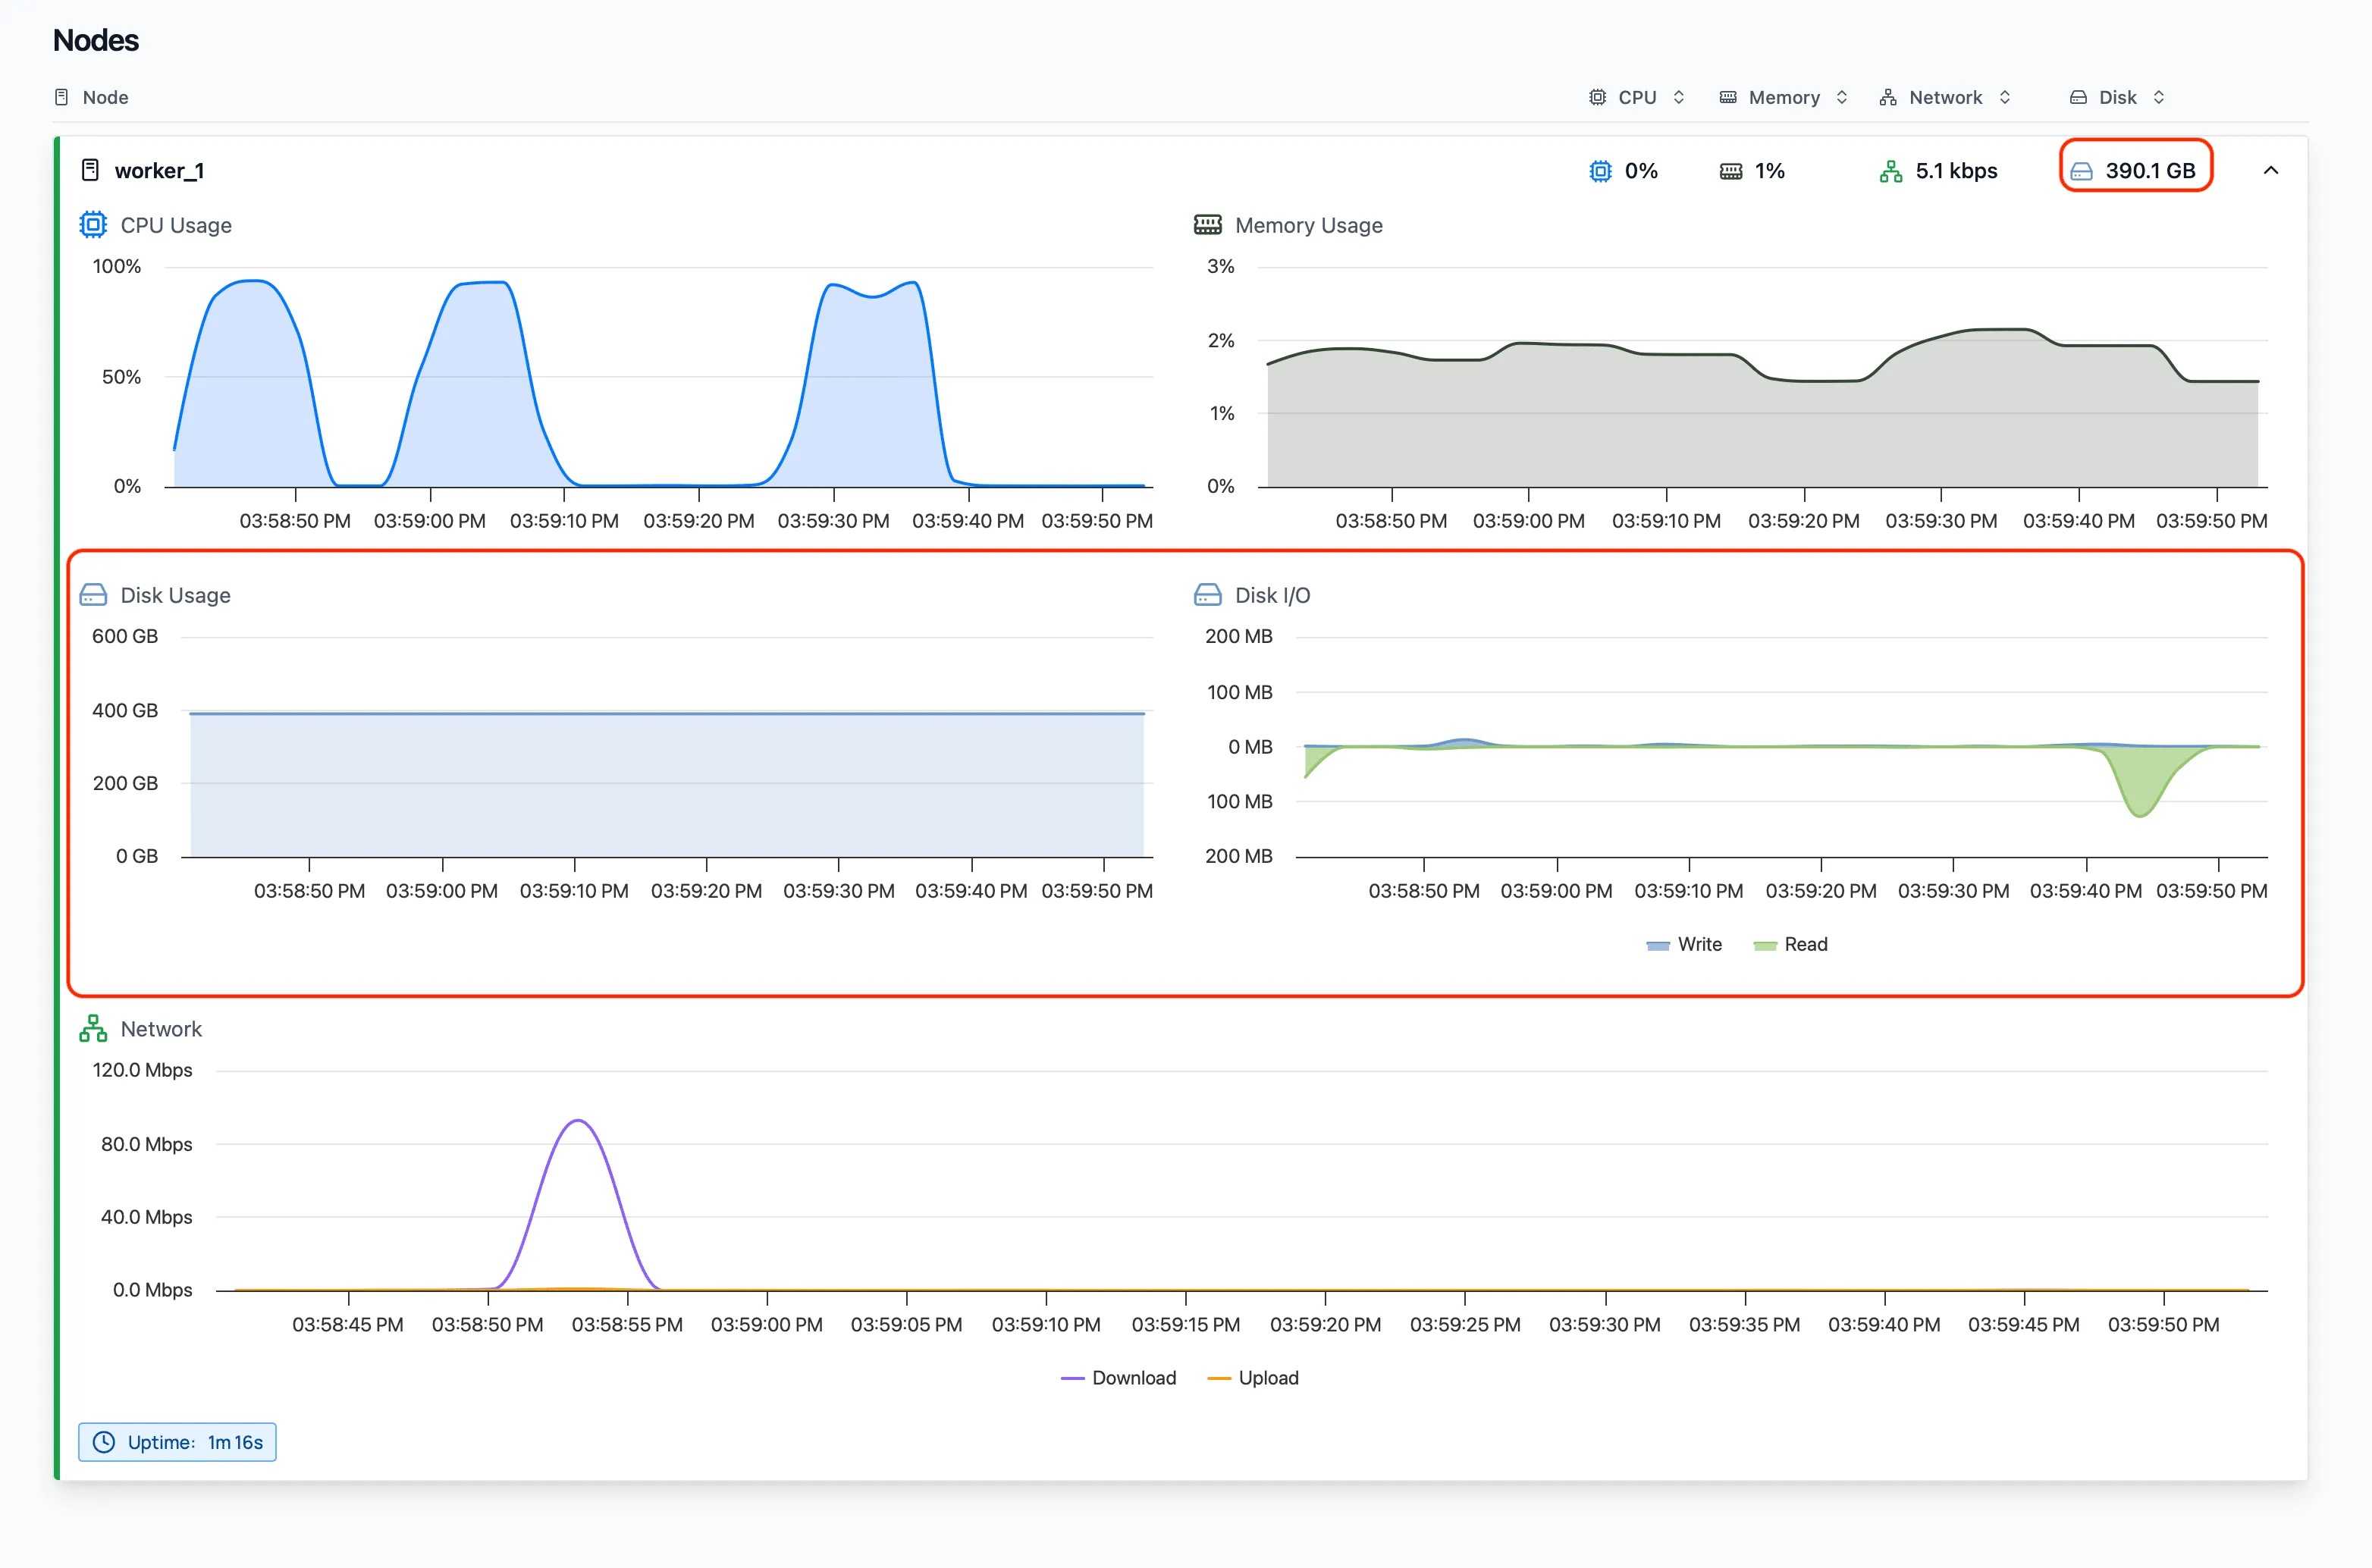
These metrics are available in the cluster overview, the node list, and the per-node detail graphs, making it easier to spot when spilling or shuffling saturates local disks.
Get Started
The full list of changes is in the 0.9.0 release notes on GitHub.
Try it out on Polars Cloud, or check the On-Prem releases to upgrade a self-hosted deployment.
Follow us for updates: