TL;DR: Polars now (from 1.6) allow you to natively create beautiful plots - no pandas / NumPy / PyArrow required!
Background: “Sorry, we only support pandas”
Polars has been gaining traction lately. One of the things users switching to Polars sometimes run into is that some of their favourite libraries still only support pandas. Fortunately, we’ve recently been seeing more and more popular libraries, such as scikit-learn and Pandera, extend their support to Polars. Today we’ll focus on a library which has not only added native support for Polars, but has also made all other heavy dependencies (pandas, NumPy, and PyArrow) optional: Altair.
Altair’s history of Polars support
Altair first introduced support for Polars in early 2023. The idea was:
- Altair already supported pandas
- Altair added support for PyArrow, and if the user inputted something that wasn’t PyArrow nor pandas, they would try different methods of converting it to PyArrow
- After conversion, the data would go down the PyArrow route
This already provided some good ergonomics to users - having their Polars DataFrames “just work” with Altair was more convenient than having to explicitly call to_pandas or to_arrow each time - but it did present some limitations:
- Some methods for converting to PyArrow weren’t reliable for certain data types, such as
DateorList - Polars users would be required to have PyArrow as a dependency
- Although converting to PyArrow is often pretty fast, that’s not always the case, especially when working with many string columns
Altair devs were keen to take it a step further to improve the user experience of non-pandas users. However, they were less keen on making their codebase more complex with specialized Polars codepaths. They were in search of a way to express their dataframe logic once and have it work for multiple kinds of input, and found this in a new library called Narwhals.
Narwhals: a tool for tool-builders
Chances are, you’ve never heard of Narwhals. That’s because it’s a tool targeted at tool builders, rather than at end users. Specifically, it allows library maintainers to support multiple dataframe libraries as inputs, without having to make any of them required. Narwhals is designed to be as lightweight and minimal-overhead as possible and has zero required dependencies.
The idea is:
- You express your dataframe logic once using the Narwhals API (which is a minimal subset of the Polars API)
- If a user inputs “dataframe X”, then computation all happens using dataframe X and the user gets back an object from “dataframe X”
- pandas users don’t need Polars installed, Polars users don’t need pandas installed, etc.
From the end-user’s point of view, Narwhals doesn’t exist, they just pass in their pandas/Polars/PyArrow/etc. objects as normal and things “just work”. Under the hood, however, the tool is using Narwhals to agnostically support all of them without requiring any. You can imagine how much this simplifies the maintenance load on library maintainers, who presumably would rather spend more time thinking about their library’s unique strengths and less time stressing over subtle API differences between dataframe libraries!
New Altair plotting backend in action
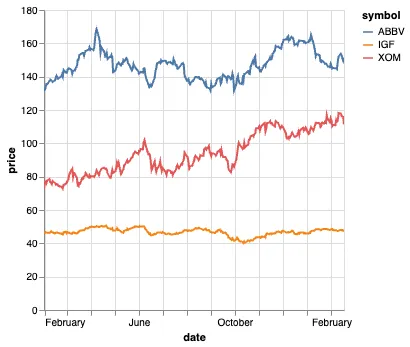
Below we can see the new plotting backend in action:
# Dataset can be found here:
# https://github.com/Mcompetitions/M6-methods/blob/main/assets_m6.csv

(
    pl.scan_csv("assets_m6.csv", try_parse_dates=True)
    .filter(pl.col("symbol").is_in(["ABBV", "IGF", "XOM"]))
    .collect()
    .plot.line(x="date", y="price", color="symbol")
)
For details, please refer to:
hvPlot is still available
In February this year, we introduced a plotting namespace to Polars which deferred to hvPlot. So, where are hvPlot-powered Polars plots going?
The answer is: nowhere. Users that prefer the hvPlot backend can keep using it by just making the following simple changes:
- Add
import hvplot.polarsto the top of your script/notebook - Instead of
df.plot, writedf.hvplot
Everything else will remain exactly as it was in versions of Polars prior to 1.6. The impact of switching the default plotting backend can be seen when we calculate the size of the environment, with the new backend with Altair having an almost 5x smaller footprint:
| backend | size |
|---|---|
| Polars + Altair | 114 MB |
| Polars + HvPlot + PyArrow | 550 MB |
A small lightweight environment helps with effective dependency management and ease of deployment. Furthermore, not having to wait for imports of extra libraries + data conversion makes it feel much more streamlined to users.
Concluding remarks
Switching the plotting backend of Polars to Altair ensures a fast and lightweight experience for users looking to plot their dataframes.
As a bonus, Marimo users making use of marimo.ui.altair_chart will be pleased to know that Marimo devs reacted very quickly to the change, and now they also support Polars natively!
We hope this is just a first step towards greater dataframe-agnosticism, and “we only support pandas” will eventually become a problem of the past.